A cross-impact matrix can provide a systematic way to evaluate various economic development programs according to defined goals. Use of this method can aid in determining the most effective program(s) for your community.
A matrix chart is utilized to list the economic programs in the left column and various economic development goals across the top. For each program, a perecentage rating is given to each goal based on how well that program would satisfy that goal. A program that satisfied a goal completely would get a rating of 100 (or 100 percent satisfaction). Most goals would only partially satisfy a goal, and a corresponding value would be inserted. (For further refinement, the goals can be "weighted." For example, a goal may be determined to be twice as important as other goals, and the matrix value for that goal should be multiplied by 2 for all programs.)
When the matrix boxes have been filled in, the numbers for each program are added together and the sum placed to the right of the matrix. These sums are compared, and the programs with the highest totals are assumed to offer the most overall benefit to the community.
A cross-impact matrix is a subjective analysis. Users select the list of programs, determine the goals, and set the percentages as they see fit. Although this leaves much to the descretion of the user(s), and thus is subject to significant bias, it can also provide a systematic method for reviewing various programs according to goals set beforehand. As such, it should be considered just one of a number of tools to be used in establishing a successful economic development program for a given community.
The listed economic development programs can be further evaluated by dividing the total sums for all programs by the estimated cost of each program. This "effectiveness/cost ratio" can prioritize those programs that give the most "bang for the buck!"
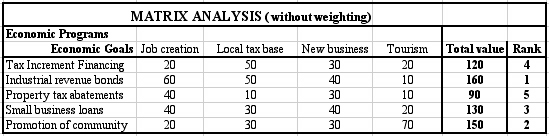
In the example in the box above, four Goals have been defined by the community, all equal in status. Five Economic Programs are being considered, and their relative impact on the four Goals is evaluated by estimating the percentage impact a Program will have on a Goal. For example, the evaluator(s) estimate that a Tax Increment Financing program would achieve 20 percent of their Job Creation goal, and 50 percent of their goal of increasing the local tax base. (These numbers are quite subjective, and should be reviewed and debated by a number of economic development specialists within the community.)
Based on these totals, it is seen that Industrial Revenue Bonds may be the most effective Program for these goals, followed closely by Promotion of the Community.
One inherent flaw in this analysis is that all the Economic Goals are treated as equals. More likely, some Goals will be considered more important than others and should be weighted more heavily in the evaluation.

In this second box, two Goals--Increasing the local tax base and Attracting tourism--are determined to be more important, and the evaluations for these Goals are weighted twice as heavily. As shown, the numbers are now doubled for these two columns.The rows are again totaled, and the Programs evaluated based on their relative rank. Note that the favored program is no longer Industrial Revenue Bonds, but becomes Promotion of the Community by a substantial margin.
From use of such a Cross-Impact Matrix Analysis, a "pseudo-objective" determination can be made of the most effective economic development programs for a local community. The analysis is only as good as the input to the matrix chart, and can easily be subject to statistical manipulation. Nevertheless, it can be an effective tool for opening a dialogue, and as such can be a useful method for initiating a look at local economic development on Goals and Programs.
| Economic development |
|---|
